
Statistics in Year 2 (age 6–7)
In Year 2, your child will learn to draw simple charts and graphs. They will be able to sort categories by their quantities and will be able to compare sets of data.
The key words for this section are block graph, pictogram, and tally chart.
What your child will learn
Take a look at the National Curriculum expectations for statistics in Year 2 (age 6–7):
Draw pictograms, tally charts, block diagrams, and tables
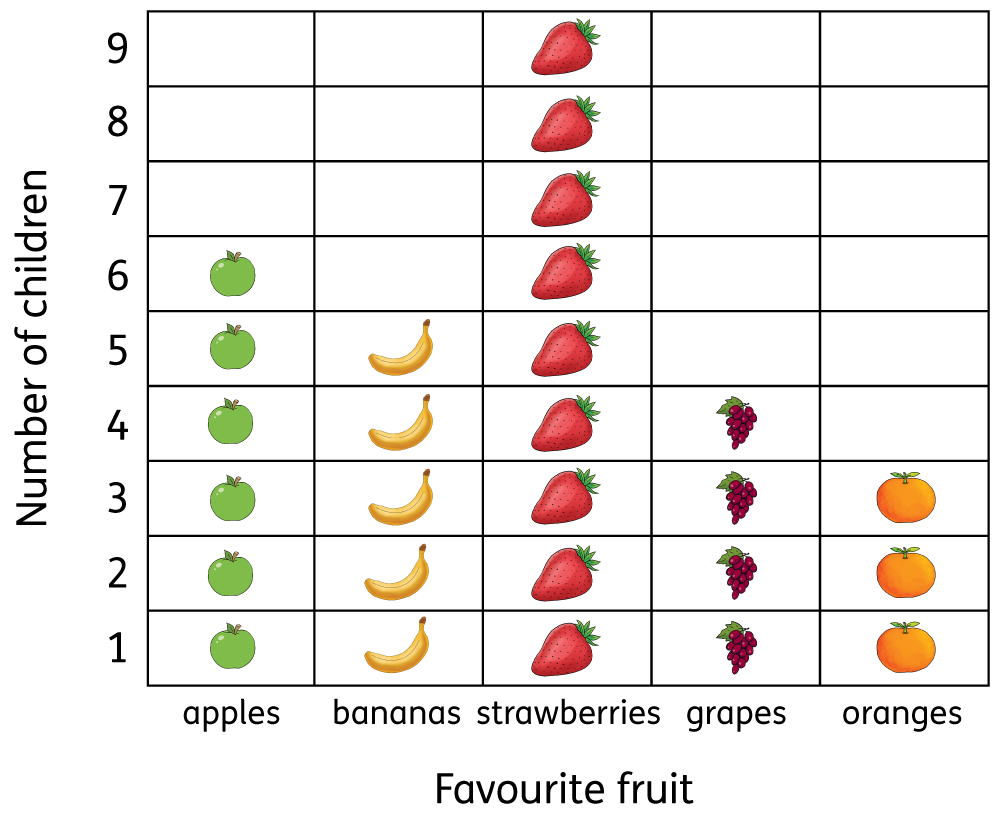
A pictogram is a graph that uses pictures to represent quantity:
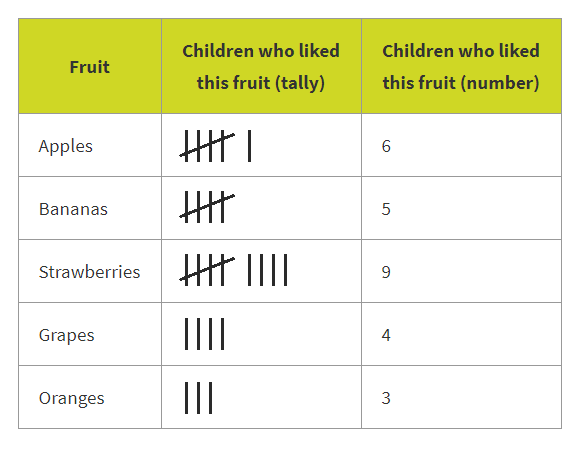
A tally chart uses marks to represent numbers:
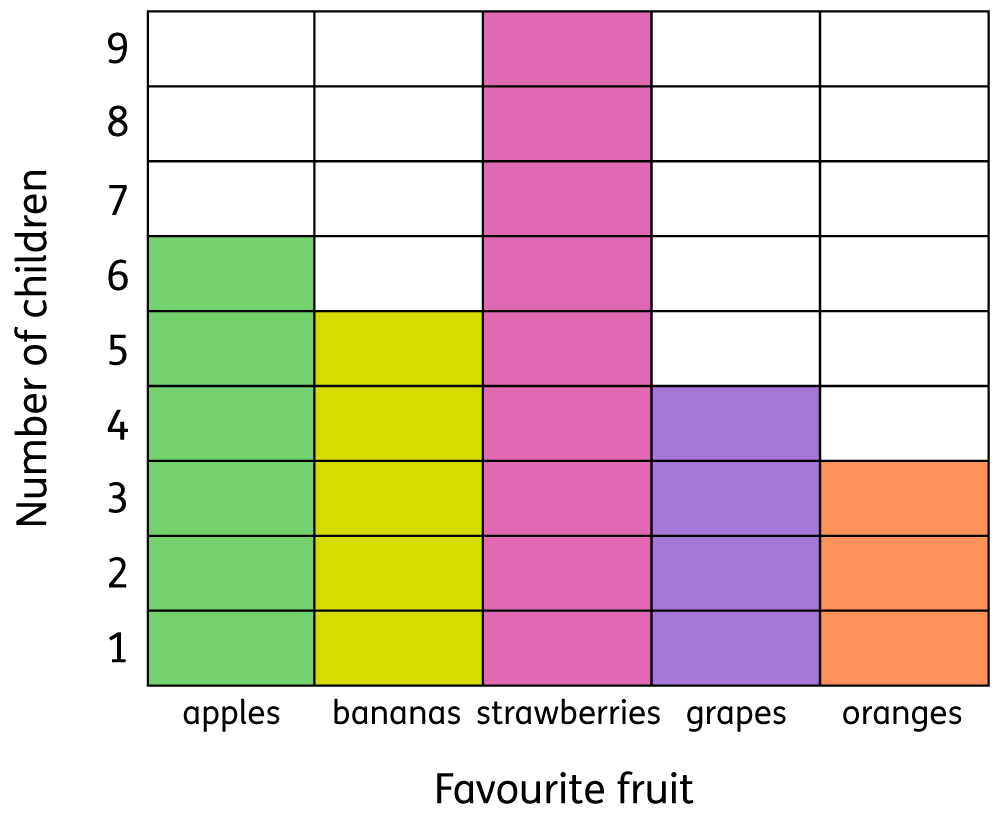
Your child will use block graphs (or block diagrams) where types of items are shown on the x-axis, the number of items is shown on the y-axis, and one block represents one item. A block graph is made up of separate blocks, and children can count the blocks to find out how many are in the group:
Count objects in multiple category and sort the categories by quantity
Your child will ask and answer simple questions about pictograms, tally charts, block graphs, and simple tables. For example:
How many children like grapes?
How many children like apples and bananas?
How many more children prefer apples to grapes?
Total and compare categorical data
Your child will ask and answer questions about data they collect. For example:
How many children took part in the survey?
What was their most popular option?
How to help at home
There are lots of everyday ways you can help your child to understand statistics. Here are just a few ideas.
1. Present data
In school, your child will be learning to present data with simple tables, pictograms, tally charts, and block graphs. You can encourage your child at home by having them investigate topics that particularly interest them and then present their data in tables, charts, and graphs.
For instance, your child could collect information about the planets in our solar system, favourite book characters, or football. See if they can create their own tables, charts, and graphs to represent the data in new and interesting ways. For example, they could by compare football players by goals scored so far this season.
Your child can record their findings using tables and present them with pictograms or block graphs.
Your child might need extra help when it comes to creating block graphs. Block graphs show types of items on the x-axis, the number of items on the y-axis, and have one block representing each item:
Once your child has practised lots of different ways of showing data, your child should be able to pick when it is best to use a block graph and when it is best to use a different method. They should be able to explain why.
2. Conduct a survey
If your child would prefer to gather their own data, why not do a survey? They could ask family and friends about their favourite food, film, sport, or anything else that takes their fancy.
Encourage your child to analyse their data and discuss any interesting findings. For example, did lots of people have the same favourite food? How many more people chose the most popular choice compared to the least popular choice?
Ask questions about the data they have found and encourage your child to begin asking their own questions, such as, ‘If I asked this question at school, would I get different results?’
3. Interpret data
You can help your child learn to interpret data in the form of tables, pictograms, tally charts, and block graphs by encouraging them to explore interesting topics. For example, if your child is interested in football, encourage them to interpret football team statistics in tables, charts, and graphs. You can find lots of examples online and in football magazines.
Look at non-fiction texts together. Can your child find any data presented in interesting ways? Encourage them to chat about the data they find and point out anything they would not have expected.