
Statistics in Year 4 (age 8–9)
In Year 4, your child will learn to use time graphs. They will also solve problems by interpreting and analysing graphs, and will be able to answer more complex questions based on statistics.
The key word for this section is scale.
What your child will learn
Take a look at the National Curriculum expectations for statistics in Year 4 (age 8–9):
Interpret discrete and continuous data using bar charts and time graphs
They will begin to understand how graphical representations of data can show and record changes over time. To this end, your child will be introuced to time graphs (a form of line graph) like this one:
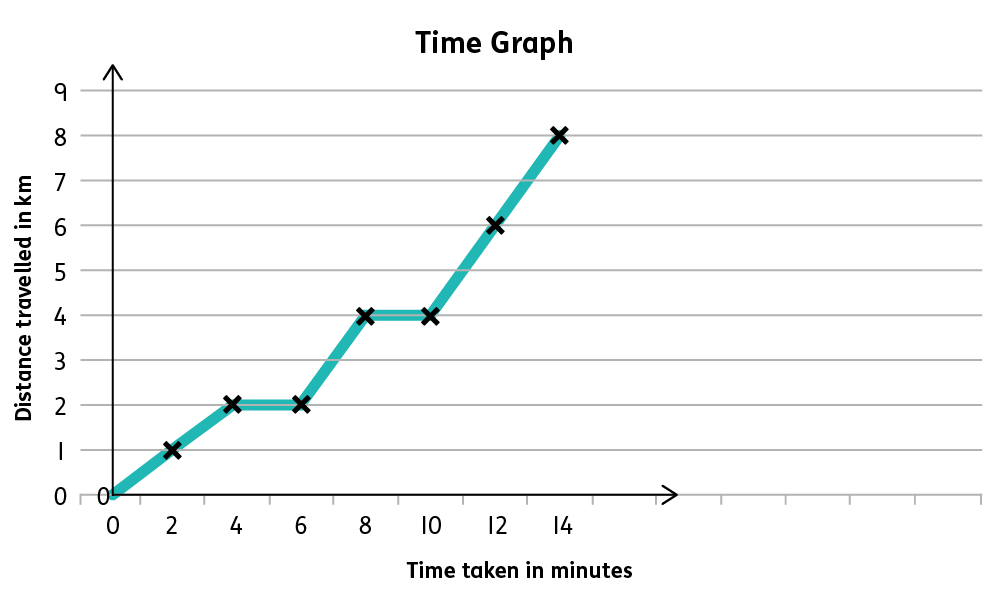
Your child will answer questions using time graphs. For example, they may need to work out the distance travelled in ten minutes, to find the total journey length, or to point out when the car was not moving.
Your child will use a greater range of scales in their graphs. This means that each mark on the scales of the y-axis might now not represent one item. They will need to read the scales to interpret the axis.
Solve problems using information from bar charts, pictograms, tables, and other graphs
What is the total number of children who preferred apples and grapes?
What is the difference in the number of children who preferred strawberries to oranges?
Your child will solve problems by comparing information from graphs. For example:
Using the graph, what is the difference in temperature between Monday and Friday last week?
Total and compare categorical data
Your child will ask and answer questions about data they collect, and will be able to make comparisons using the data. For example:
How many children took part in the survey?
Which option was most popular? Which was least popular?
How to help at home
There are lots of everyday ways you can help your child to understand statistics. Here are just a few ideas.
1. Create a time graph
Time graphs show distance travelled over time. The vertical y-axis of a time graph shows the distance travelled, and the horizontal x-axis shows the time it has taken. Your child will learn to create time graphs by plotting points on the graph and then connecting these points to create a continuous line.
Your child will be given a table of data such as:
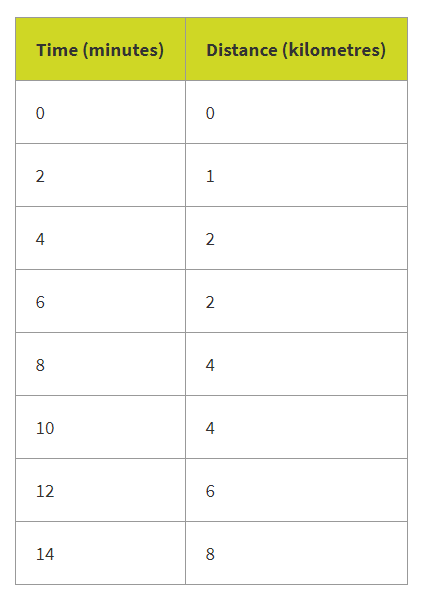
They will then plot this information as points on the graph and join the points to create a continuous line:
See if your child to create their own time graph. They can gather data themselves – for example, tracking a walk, a bike ride, or their journey to school. Can they present the data in a table and present the data in a time graph? Multiple lines representing different days could also show improvement at a distance sport like running.
2. Interpret data
There are many non-fiction books that present data in interesting ways. Discuss with your child why the author of the book has decided to present the information in a particular way.
Ask questions and encourage your child to ask their own questions about data. Pay careful attention to the scales on the graphs and support children to read these accurately. This can help your child learn to spot data that is shown in a potentially misleading way, a very useful life skill!
3. Create charts and graphs using a computer
Why not encourage your child to explore computer programs (like Excel or Google Sheets) to create their own tables and graphs?
For example, your child could compare different types of animals using statistics like population, size, or life expectancy. They could then come up with a series of questions for you to answer using their charts. Which animals are the most populous? How much bigger is the biggest animal than the smallest animal?
Once they have practised lots of ways of showing information, your child should be able to decide which ways of showing data are most appropriate to different situations and to be able to explain why.
Activity: Data handling
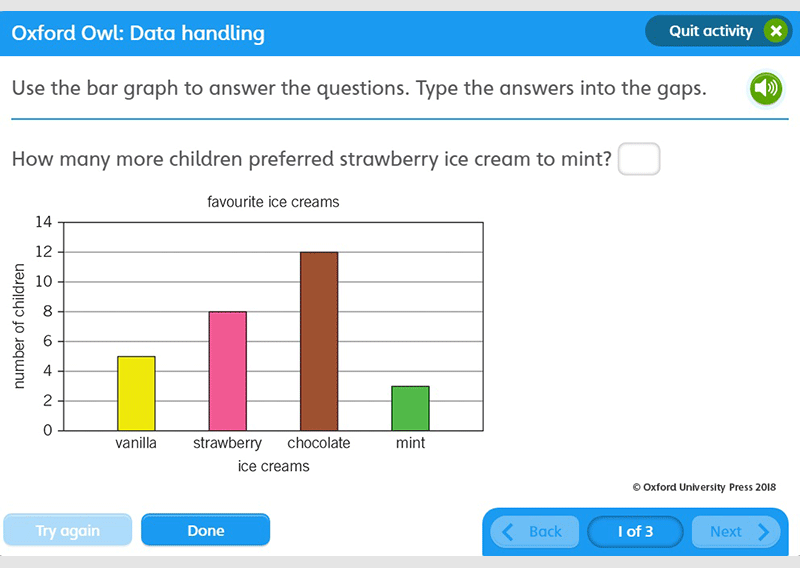
Use the bar graph to answer questions.