
Statistics in Year 3 (age 7–8)
In Year 3, your child will learn to interpret and create lots of types of graphs. They will solve two-step problems involving tables and charts.
The key words for this section are bar chart, continuous data, discrete data, scale, and tally chart.
What your child will learn
Take a look at the National Curriculum expectations for statistics in Year 3 (age 7–8):
Interpret and present data using bar charts, pictograms, and tables
A bar chart is used to represent discrete data rather than continuous data. Discrete data can only have a limited number of possible values (for example, hair colour or shoe size). Continuous data can have an infinite number of possible values within a selected range (for example, temperature).
A bar chart is a way of showing data by the lengths of a set of bars. There should be gaps between the bars. The bars can be drawn horizontally or vertically. A bar chart shows the data as single bars and so requires reading and interpreting the scale of the y-axis to identify the value.
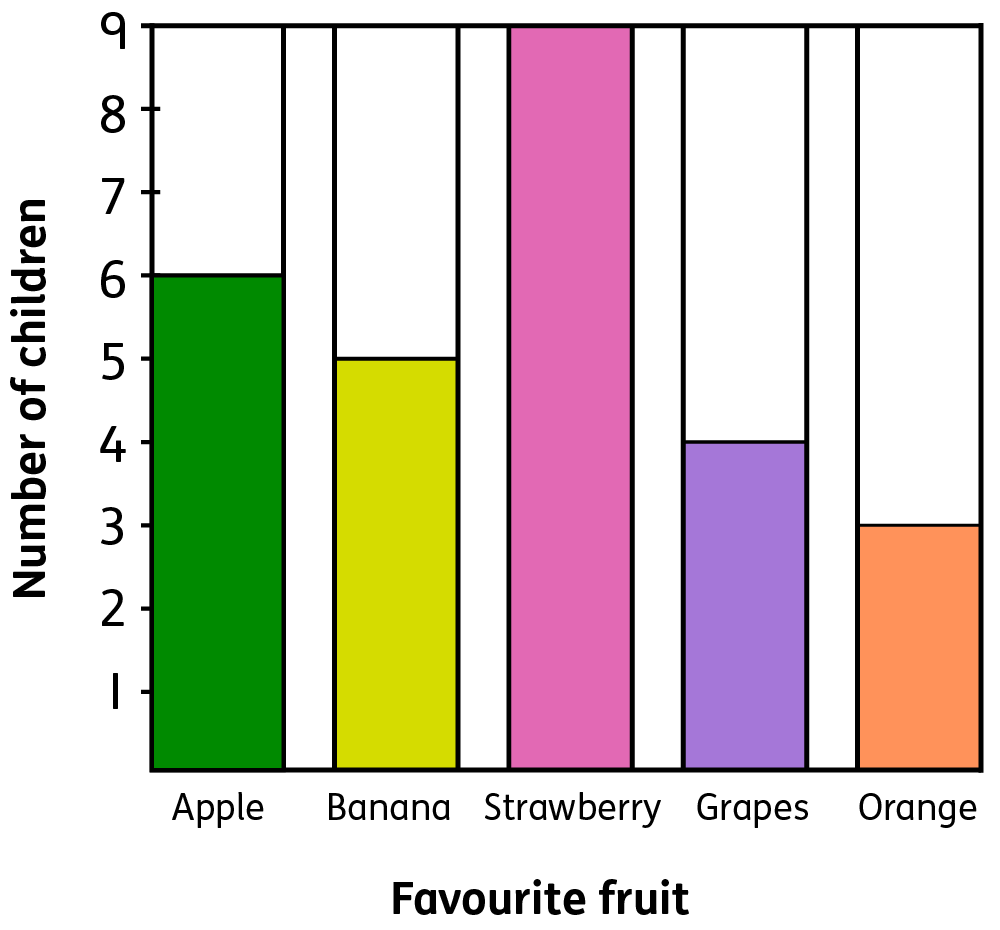
Solve two-step questions using scaled bar charts, pictograms, and tables
How many fewer children preferred bananas to strawberries?
What is the total number of children who preferred apples and bananas?
Your child will use the scale on the y-axis on bar charts and pictograms (for example, 5 per picture) to work out the value of that group. Using a ruler to accurately read the charts’ values may help with this.
How to help at home
There are lots of everyday ways you can help your child to understand statistics. Here are just a few ideas.
1. Present data
In school, your child will learn to present data in a variety of ways using tables, charts, pictograms, and graphs. You can encourage your child at home by having them investigate and make graphs about topics that interest them. For instance, your child could collect and analyse information about animals, plants, or sports.
Encourage your child to find data about family and friends, such as their favourite books or favourite ice cream flavours. They could create their own tables, charts, and graphs to represent the data in interesting ways.
Discuss the different ways your child could present what they have found. They should be able to decide which ways of showing data are most appropriate and to explain why. For example, a pictogram might be most appropriate to show popular ice cream flavours because it is good for comparing small, discrete data sets.
Your child can collect data using tally charts or tables like this:
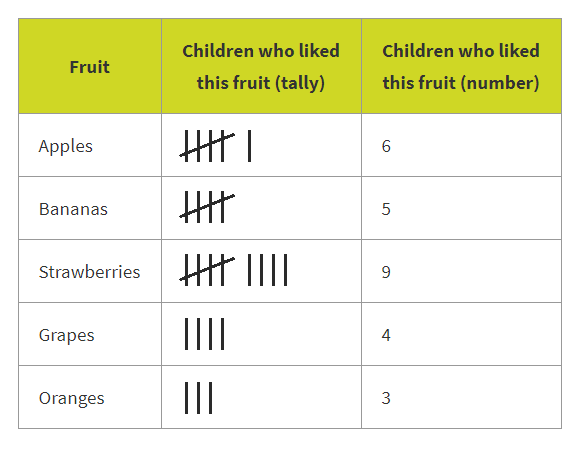
Your child will be able to present this data in the form of a bar chart. In this example, the names of the fruits will be on the x-axis and the number of children who choose each piece of fruit will be on the y-axis.
When creating bar charts, make sure your child leaves a gap between each bar as they are representing discrete data. Help them create accurate scales for their bar charts.
2. Interpret data
Ask your child questions about the bar charts they have made. For example:
What was the least popular fruit?
How many people like strawberries and oranges?
How many more people preferred apples to oranges?
How many people took part in the survey?
Non-fiction books such as The Guinness Book of Records provide examples of real-life data that your child could explore. Discuss why information is presented in different ways. Ask questions and encourage your child to ask their own questions about the data. Can you spot any statistics that surprise you?
3. Practise using tables and charts
Encourage your child to plan or record their own activities. This will also help them to become familiar with creating and using charts and tables.
If they need some real-life inspiration for creating tables and charts, try these activity sheets:
Activity: My Weekly Training Plan
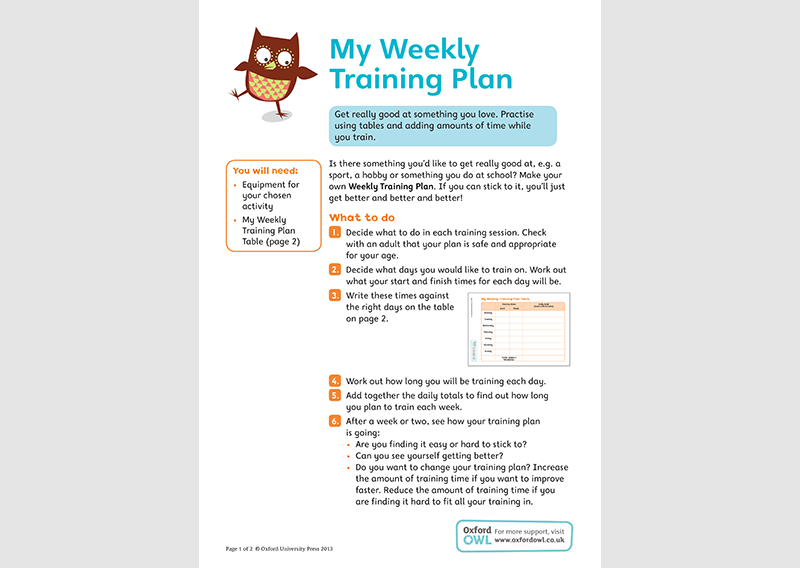
Practise using tables and adding amounts of time with this weekly training plan.
Activity: Mega-star Reward Chart
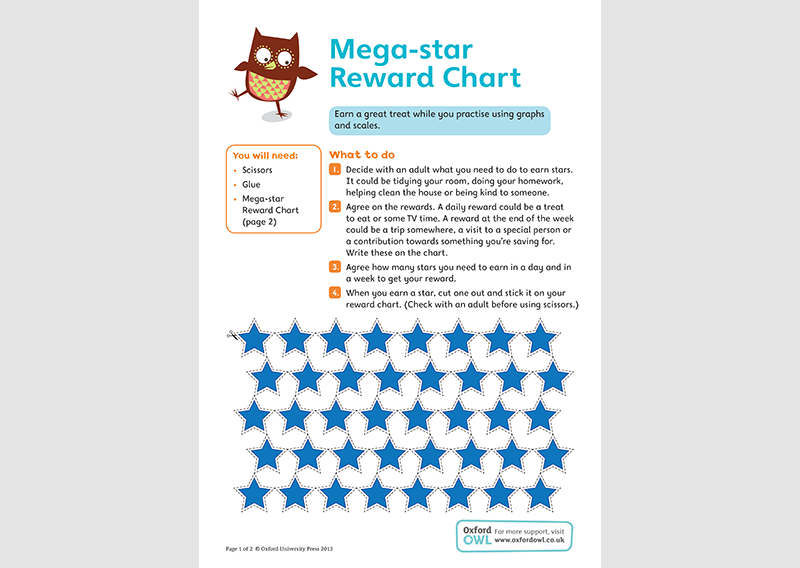
Earn a great treat while you practise using graphs and scales.