Statistics in Year 5 (age 9–10)
In Year 5, your child will learn to read and create number lines. They will interpret timetables and will solve problems using statistical information from graphs and charts.
The key words for this section are continuous data and discrete data.
What your child will learn
Take a look at the National Curriculum expectations for statistics in Year 5 (age 9–10):
Solve problems using information from a line graph
Your child will read information presented in a range of ways, including line graphs.
Line graphs represent information that changes over time. Continuous data, which can have an infinite number of possible values within a selected range (such as temperature), is used to create line graphs.
Your child will solve problems using line graphs. They will be expected to use them to compare information and solve addition and subtraction problems. For example:
Using the line graph, what is the difference in temperature between Monday and Friday last week?
Your child will need to show data using time graphs by plotting points using the scales on the axes. Time will be plotted on the horizontal x-axis and distance will be plotted on the vertical y-axis.
Read and interpret information in tables, including timetables
Your child will read and understand the information presented in tables (including timetables). They will also be able to complete tables using data from written questions or graphs.
How to help at home
There are lots of everyday ways you can help your child to understand statistics. Here are just a few ideas.
1. Present and interpret data
In school, your child will collect data in the form of tables, and will present it using a variety of charts and graphs. They will also present discrete data, such as days of the week, using bar charts.
Your child will create and interpret time graphs and other line graphs, such as graphs showing temperature. Why not make a line graph with your child to show the temperature over the last week? Are things getting warmer, or colder, or staying the same?
2. Find data in the real world
Keep a look out for tables, charts, and graphs used in real-life situations such as in newspaper articles and non-fiction books. Discuss with your child why they think the author may have chosen to represent the data using that particular graph. Talk about what the data is showing and ask your child some questions about it.
3. Make a timetable
Your child will read and understand information presented in tables, such as timetables, and will be able to finish incomplete tables too. Timetables provide a great opportunity to practise maths skills in a real-life scenario.
When travelling on public transport, encourage your child to use the information in timetables. You could ask them to find out what time the next bus or train is scheduled or calculate how long their journey should take. Why not encourage your child to make their own timetables for their daily routines?
4. Work with data
There are plenty of opportunities for your child to use charts, tables, and graphs at home. They could record their own performance in an activity, or monitor something they are interested in, such as how many bugs they can spot in the garden.
Encourage your child to think carefully about how best to display their information. Your child could then look at the data they have displayed and analyse it – for example, they could work out if a particular time of day is good for spotting bugs.
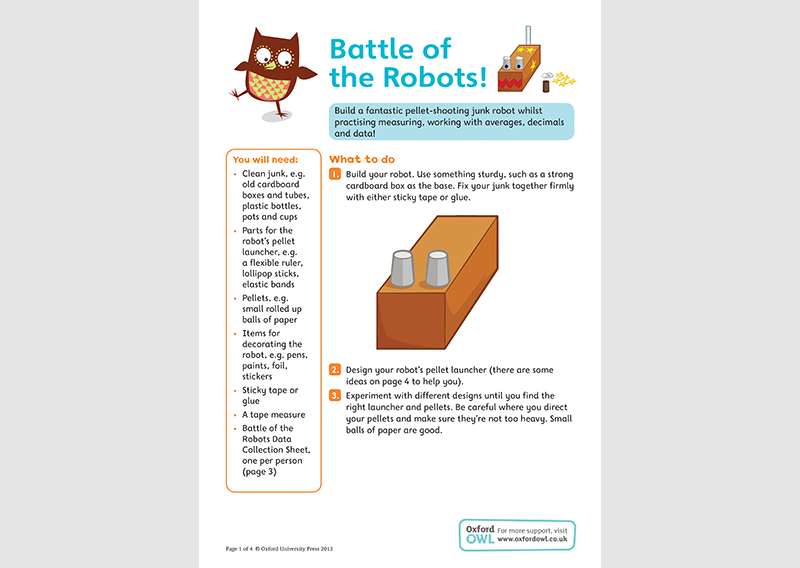
To practise recording data, try building a robot and measuring how far it can throw with our activity sheet:
Activity: Battle of the robots

Build your very own robots and learn how to record their performance.
